Country Profile
Czech Republic
General Information
- Area: 78,867 sq. km
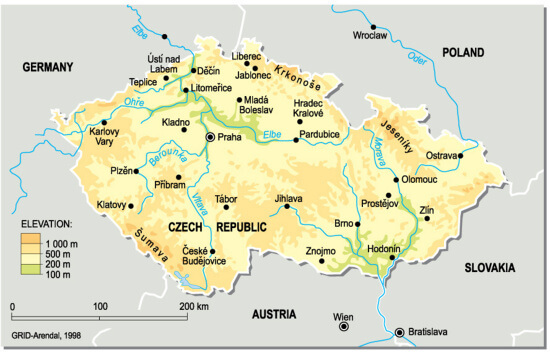
- Capital: Prague (Praha)
- Population: 10,5 million
- Region: Central Europe
- Border countries: Germany, Austria, Poland and Slovakia
- Official language: Czech
- Official currency: Koruna (Kč) - Czech Crown (CZK)
- Political system: Parliamentary democracy
For more information download our publication:
Download Czech Republic Overview 2016/2017
For more information about Czech Competitiveness go to: www.czechcompete.cz
Data
1. Gross Domestic Product (GDP)
GDP per capita in purchasing power standard (EU28 = 101, from 2020 EU27 = 100)
| 2011 | 2012 | 2013 | 2014 | 2015 | 2016 | 2017 | 2018 | 2019 | 2020 | 2021 | 2022 | 2023 | |
| Czech Republic | 84 | 84 | 85 | 88 | 89 | 89 | 91 | 92 | 93 | 93 | 92 | 90 | 91 |
| Hungary | 67 | 67 | 68 | 69 | 70 | 69 | 69 | 71 | 73 | 74 | 75 | 76 | 76 |
| Poland | 66 | 67 | 67 | 68 | 69 | 69 | 70 | 71 | 73 | 76 | 77 | 79 | 80 |
| Slovakia | 76 | 77 | 77 | 78 | 78 | 73 | 71 | 70 | 71 | 74 | 73 | 71 | 73 |
| Germany | 124 | 124 | 125 | 127 | 124 | 125 | 124 | 124 | 121 | 123 | 119 | 117 | 115 |
| Austria | 129 | 133 | 133 | 132 | 131 | 130 | 127 | 127 | 126 | 125 | 122 | 124 | 123 |
| EU 27 (from 2020) | 100 | 100 | 100 | 100 | |||||||||
| EA 20 (from 2023) | 104 | ||||||||||||
| EU 28 | 101 | 101 | 101 | 101 | 101 | 101 | 101 | 101 | 101 | ||||
| EA 19 (2015-2022) | 109 | 108 | 108 | 108 | 108 | 107 | 107 | 107 | 106 | 105 | 105 | 104 |
Source: Eurostat
| GDP volume | 2011 | 2012 | 2013 | 2014 | 2015 | 2016 | 2017 | 2018 | 2019 | 2020 | 2021 | 2022 | 2023 |
| CZK Billion, Current prices | 4,062.3 | 4088.9 | 4,142.8 | 4,345.8 | 4,625.4 | 4,796.9 | 5,110.7 | 5,409.7 | 5,790.3 | 5,709.1 | 6,108,7 | 6,795,1 | 7,344,1 |
| GDP per capita, CZK | 2011 | 2012 | 2013 | 2014 | 2015 | 2016 | 2017 | 2018 | 2019 | 2020 | 2021 | 2022 | 2023 |
| CZK, Current prices | 387,011 | 389,076 | 394,151 | 412,908 | 438,718 | 454,022 | 482,622 | 509,180 | 542,818 | 533,556 | 571,051 | 634,993 | 686,074 |
| GDP real growth % y/y | 2011 | 2012 | 2013 | 2014 | 2015 | 2016 | 2017 | 2018 | 2019 | 2020 | 2021 | 2022 | 2023 |
| 1.8 | -0.8 | -0.0 | 2.3 | 5.4 | 2.5 | 5.2 | 3.2 | 3.0 | -5.5 | 3,6 | 2.4 | -0.3 |
Source: Czech Statistical Office
2. Inflation
Inflation rates
| Year | 2010 | 2011 | 2012 | 2013 | 2014 | 2015 | 2016 | 2017 | 2018 | 2019 | 2020 | 2021 | 2022 | 2023 |
| Inflation rate (avg.) | 1.5 | 1.9 | 3.3 | 1.4 | 0.4 | 0.3 | 0.7 | 2.5 | 2.1 | 2.8 | 3.2 | 3.8 | 15.1 | 10.7 |
Source: Czech Statistical Office
| HICP - Annual average rate of change in Harmonized Indices of Consumer Prices (HICPs) | 2011 | 2012 | 2013 | 2014 | 2015 | 2016 | 2017 | 2018 | 2019 | 2020 | 2021 | 2022 | 2023 | |
|---|---|---|---|---|---|---|---|---|---|---|---|---|---|---|
| Czech Republic | 2.2 | 3.5 | 1.4 | 0.4 | 0.3 | 0.6 | 2.4 | 2.0 | 2.6 | 3.3 | 3.3 | 14.8 | 12.0 | |
| Hungary | 3.9 | 5.7 | 1.7 | 0.0 | 0.1 | 0.4 | 2.4 | 2.9 | 3.4 | 3.4 | 5.2 | 15.3 | 17.0 | |
| Poland | 3.9 | 3.7 | 0.8 | 0.1 | -0.7 | -0.2 | 1.6 | 1.2 | 2.1 | 3.7 | 5.2 | 13.2 | 10.9 | |
| Slovakia | 4.1 | 3.7 | 1.5 | -0.1 | -0.3 | -0.5 | 1.4 | 2.5 | 2.8 | 2.0 | 2.8 | 12.1 | 11.0 | |
| Germany | 2.5 | 2.2 | 1.6 | 0.8 | 0.7 | 0.4 | 1.7 | 1.9 | 1.4 | 0.4 | 3.2 | 8.7 | 6.0 | |
| Austria | 3.6 | 2.6 | 2.1 | 1.5 | 0.8 | 1.0 | 2.2 | 2.1 | 1.5 | 1.4 | 2.8 | 8..6 | 7.7 | |
| EU 27 from 2020 | 0.7 | 2.9 | 9.2 | 6.4 | ||||||||||
| EU 28 | 3.1 | 2.6 | 1.5 | 0.6 | 0.1 | 0.2 | 1.7 | 1.9 | 1.5 | |||||
| EA 19 (2015-2022) | 2.7 | 2.5 | 1.3 | 0.4 | 0.2 | 0.2 | 1.5 | 1.8 | 1.2 | 0.3 | 2.6 | 8.4 | ||
| EA 20 (from 2023) | 5.4 | |||||||||||||
Source: Eurostat
3. Interest Rate
| 3 month interest rate, Monthly average (NSA) | |||||||||||||||||||||||||||
|---|---|---|---|---|---|---|---|---|---|---|---|---|---|---|---|---|---|---|---|---|---|---|---|---|---|---|---|
| 12/17 | 01/18 | 02/18 | 03/18 | 04/18 | 05/18 | 06/18 | 07/18 | 08/18 | 09/18 | 10/18 | 10/19 | 12/19 | 01/20 | 02/20 | 03/20 | 04/20 | 05/20 | 05/21 | 11/21 | 02/22 | 04/22 | 09/22 | 12/22 | 02/23 | 12/23 | 03/24 | |
| EA (EA 20 from 2023) | -0.34 | -0.36 | -0.36 | -0.36 | -0.37 | -0.36 | -0.36 | -0.36 | -0.36 | -0.36 | -0.37 | -0.41 | -0.39 | -0.39 | -0.41 | -0.42 | -0.25 | -0.27 | -0.54 | -0.57 | -0.53 | -0.44 | 1.01 | 2.06 | 2.64 | 3.93 | 3.92 |
| Czech Republic | 0.50 | 0.50 | 0.74 | 0.75 | 0.75 | 0.75 | 0.76 | 1.00 | 1.23 | 1.26 | 1.50 | 2.17 | 2.18 | 2.17 | 2.34 | 2.00 | 0.97 | 0.46 | 0.36 | 2.97 | 4.6 | 5.3 | 7.25 | 7.26 | 7.20 | 6.97 | 5.84 |
| Poland | 1.51 | 1.42 | 1.55 | 1.64 | 1.61 | 1.51 | 1.58 | 1.54 | 1.46 | 1.62 | 1.55 | 1.72 | 1.70 | 1.71 | 1.71 | 1.45 | 0.83 | 0.66 | 0.21 | 1.57 | 3.3 | 5.4 | 7.16 | 7.11 | 6.93 | 5.85 | 5.86 |
| Hungary | -0,01 | -0.07 | -0.06 | -0.07 | -0.06 | -0.02 | -0.01 | -0.01 | -0.02 | 0.00 | 0.07 | 0.20 | 0.15 | 0.18 | 0.44 | 0.49 | 1.09 | 0.88 | 2.58 | 4.4 | 6.3 | 13.1 | 16.45 | 10.57 | 8.38 | ||
Source: Eurostat
2 Week Repo, Discount rate, Lombard rate
| 2 Jun 2012 | 1 Oct 2012 | 2 Nov 2012 | 2 Feb 2018 | 28 Jun 2018 | 3 Aug 2018 | 27 Sep 2018 | 2 Nov 2018 | 3 May 2019 | 7 Feb 2020 | 17 Mar 2020 | 27 Mar 2020 | 11 May 2020 | 1 Oct 2021 | 5 Nov 2021 | 23 Dec 2021 | 4 Feb 2022 | 1 Apr 2022 | 6 May 2022 | 23 Jun 2022 | 22 Dec 2023 | 9 Feb 2024 | 21 Mar 2024 | 3 May 2024 | ||
| 2 Week Repo | 0.50 | 0.25 | 0.05 | 0.75 | 1.00 | 1.25 | 1.50 | 1.75 | 2.00 | 2.25 | 1.75 | 1.00 | 0.25 | 1.50 | 2.75 | 3.75 | 4.50 | 5.00 | 5.50 | 7.00 | 6.75 | 6.25 | 5.75 | 5.25 | |
| Discount rate | 0.25 | 0.10 | 0.05 | 0.05 | 0.05 | 0.25 | 0.50 | 0.75 | 1.00 | 1.25 | 0.75 | 0.05 | 0.05 | 0.5 | 1.75 | 2.75 | 3.50 | 4.00 | 4.75 | 6.00 | 5.75 | 5.25 | 4.75 | 4.25 | |
| Lombard rate | 1.50 | 0.75 | 0.25 | 1.5 | 2.00 | 2.25 | 2.50 | 2.75 | 3.00 | 3.25 | 2.75 | 2.00 | 1.00 | 2.5 | 3.75 | 4.75 | 5.50 | 6.00 | 6.75 | 8.00 | 7.75 | 7.25 | 6.75 | 6.25 | |
Source: Czech National Bank
4. Labor Market
Unemployment rate (average)
| Year | 2012 | 2013 | 2014 | 2015 | 2016 | 2017 | 2018 | 2019 | 2020 | 2021 | 2022 |
| Unemployment rate (avg.) | 7.0 | 7.0 | 6.1 | 5.0 | 4.0 | 2.9 | 2.2 | 2.0 | 2.6 | 2.8 | 2.2 |
Source: Czech Statistical Office
| Average gross monthly wage | Avg. nominal wage (CZK) | Median wage, private sector (CZK) |
|---|---|---|
| Q1 2014 | 24,931 | |
| Q2 2014 | 25,569 | |
| Q3 2014 | 25,279 | |
| Q4 2014 | 27,261 | Q1-4 2014 22,097 |
| Q1 2015 | 25,497 | |
| Q2 2015 | 26,408 | |
| Q3 2015 | 26,163 | |
| Q4 2015 | 28,258 | Q1-4 2015 23,062 |
| Q1 2016 | 26,683 | |
| Q2 2016 | 27,452 | |
| Q3 2016 | 27,396 | |
| Q4 2016 | 29,491 | Q1-4 2016 24,265 |
| Q1 2017 | 28,034 | |
| Q2 2017 | 29,432 | |
| Q3 2017 | 29,234 | |
| Q4 2017 | 31,802 | Q1-4 2017 25,994 |
| Q1 2018 | 30,427 | |
| Q2 2018 | 32,003 | |
| Q3 2018 | 31,685 | |
| Q4 2018 | 34,057 | Q1-4 2018 28,431 |
| Q1 2019 | 32,951 | |
| Q2 2019 | 34,576 | |
| Q3 2019 | 34.127 | |
| Q4 2019 | 36,636 | Q1-4 2019 30,158 |
| Q1 2020 | 34,197 | |
| Q2 2020 | 34,382 | |
| Q3 2020 | 35,487 | |
| Q4 2020 | 38,584 | Q1-4 2020 31,579 |
| Q1 2021 | 35,338 | |
| Q2 2021 | 38,292 | |
| Q3 2021 | 37,499 | |
| Q4 2021 | 40,224 | Q1-4 2021 33,552 |
| Q1 2022 | 37,979 | |
| Q2 2022 | 40,093 | |
| Q3 2022 | 39,880 | |
| Q4 2022 | 43,412 | Q1-4 2022 34,562 |
| Q1 2023 | 41,265 | |
| Q2 2023 | 43,193 | |
| Q3 2023 | 42,658 | |
| Q4 2023 | 46,013 | |
| Q1-4 2023 | 43,341 | Q1-4 2023 38,236 |
Source: Czech Statistical Office, www.ispv.cz
5. Education
| Graduates | 2013 | 2014 | 2015 | 2016 | 2017 | 2018 | 2019 | 2020 | 2021 | 2022 |
|---|---|---|---|---|---|---|---|---|---|---|
| 26 Public Universities | 76,594 | 74,426 | 74,426 | 67,417 | 63,080 | 60,211 | 56,813 | 55,684 | 53,990 | 52,532 |
| 32 Private Universities (2022) | 15,107 | 13,767 | 11,445 | 9,968 | 8,987 | 8,362 | 7,373 | 7,230 | 6,608 | 6,172 |
| Total | 91,693 | 88,257 | 82,039 | 77,382 | 72,084 | 68,576 | 64,253 | 62,961 | 60,595 | 58,699 |
| ICT | 4,934 | 4,711 | 4,479 | 4,361 | 3,916 | 3,802 | 3,606 | 3,673 | 3,801 | 3,584 |
| Technical, manufacturing, construction | 13,966 | 13,731 | 13,416 | 12,586 | 12,278 | 11,520 | 10,793 | 10,388 | 9,355 | 8,484 |
| Natural sciences, maths, statistics | 4,504 | 4,292 | 4,102 | 4,149 | 3,936 | 4,030 | 3,820 | 3,739 | 3,736 | 4,163 |
| ICT, Technical, Natural sciences as % of Total | 25.52% | 25.76% | 26.81% | 27.26% | 27.93% | 28.22% | 28.36% | 28.27% | 27.88% | 27.65% |
Source: Ministry of Education, Youth and Sport, Czech Statistical Office, see also regional data and foreigners
| Active Population, Structure by Educational Attainment | in thousands | % | |||||||||
|---|---|---|---|---|---|---|---|---|---|---|---|
| 2017 | 2018 | 2020 | 2021 | 2022 | |||||||
| Elementary school | 257.2 | 5% | 254.3 | 4% | 268,1 | 4.99% | 249.4 | 4.6% | 215.2 | 4.16% | |
| Vocational school | 1,830.1 | 34% | 1,819.6 | 34% | 1,759.9 | 32,76% | 1,703.3 | 31.8% | 1,653.9 | 31.97% | |
| Secondary school | 1,985.9 | 37% | 2,006.5 | 37% | 2,011.7 | 37.45% | 1,980.4 | 36.9% | 1,907.0 | 36.86% | |
| University education | 1,302.3 | 24% | 1,333.2 | 25% | 1,331.4 | 24.79% | 1,429.8 | 26.7% | 1,395.6 | 26.98% | |
Source: Czech Statistical Office
6. Healthcare
| International Comparison of expenditure on healthcare (based on OECD Health Statistics) | Public expenditure on healthcare as % of total, 2017 | 2018 | 2019 | 2020 | 2021 | 2022 | Total expenditure on healthcare as % of GDP, 2017 | 2018 | 2019 | 2020 | 2021 | 2022 | Total Health Care expenditure per capita, current prices, PPP, 2017 | 2018 | 2019 | 2020 | 2021 | 2022 |
|---|---|---|---|---|---|---|---|---|---|---|---|---|---|---|---|---|---|---|
| Czech Republic | 84.4 | 84.9 | 85 | 87.7 | 86.4 | 85.8 | 7.4 | 7.5 | 7.6 | 9.2 | 9.5 | 9.1 | 2,969,5 | 3,128.5 | 3,272.2 | 3,804.1 | 4,303.0 | 4,512.2 |
| Poland | 69.3 | 71.5 | 71.8 | 72.3 | 72.5 | 74.9 | 6.6 | 6.3 | 6.5 | 6.5 | 6.4 | 6.7 | 2,062,7 | 2,106.7 | 2,232.3 | 2,286.1 | 2,522.4 | 2,973.0 |
| Austria | 74.0 | 74.7 | 75.1 | 76.8 | 78.3 | 77.8 | 10.4 | 10.3 | 10.5 | 11.4 | 12.4 | 11.4 | 5,315.4 | 5,5518.5 | 5,625.4 | 5,863.7 | 6,690.1 | 7.275.4 |
| Germany | 84.4 | 84.1 | 84.0 | 85.1 | 85.5 | 86.5 | 11.3 | 11.5 | 11.7 | 12.7 | 12.9 | 12.7 | 5,976.5 | 6,290.1 | 6,418.3 | 6,945.9 | 7,518.2 | 8,010.9 |
| Hungary | 68.9 | 69.5 | 68.7 | 70.8 | 72.5 | 72.4 | 6.7 | 6.6 | 6.3 | 7.3 | 7.4 | 6.7 | 1,998,6 | 2,105.7 | 2,094.1 | 2,421.8 | 2,748.7 | 2,840.1 |
| Slovakia | 79.9 | 80.1 | 79.8 | 80.3 | 79.7 | 80.2 | 6.8 | 6.7 | 6.9 | 7.1 | 7.8 | 7.8 | 1,974,5 | 2,009.0 | 2,115.5 | 2,125.7 | 2,521.6 | 2,755.9 |
Source: OECD Health Statistics
According to the Czech Statistical Office, health care expenditures as a % of GDP reached 9.5% in 2021.
| Expenditures on healthcare according to sources of financing as % of total expenditures on healthcare | 2017 | 2018 | 2019 | 2020 | 2021 |
|---|---|---|---|---|---|
| Public sources | 84.4 | 84.9 | 85.0 | 87.7 | 86.4 |
| Public sources - public budgets | 12.1 | 12.7 | 12.9 | 17.5 | 15.4 |
| Public sources - public insurance | 72.3 | 72.2 | 72.1 | 70.2 | 71.0 |
| Private sources | 1.1 | 0.9 | 0.9 | 0.8 | 0.9 |
| Households | 14.5 | 14.2 | 14.1 | 11.5 | 12.7 |
Source: Czech Statistical Office
7. Tourism
| Occupancy in collective accommodation establishment (number of guests) | Total | Non-residents | Residents |
|---|---|---|---|
| 2011 | 12,898,712 | 6,715,067 | 6,183,645 |
| 2012 | 13,646,913 | 7,164,576 | 6,482,337 |
| 2013 | 13,868,336 | 7,309,856 | 6,558,480 |
| 2014 | 15,644,707 | 8,126,369 | 7,518,338 |
| 2015 | 15,981,115 | 8,095,885 | 7,885,230 |
| 2016 | 18,374,355 | 9,288,013 | 9,086,342 |
| 2017 | 20,000,561 | 10,160,468 | 9,840,093 |
| 2018 | 21,247,150 | 10,611,394 | 10,635,756 |
| 2019 | 21,998,366 | 10,890,500 | 11,107,866 |
| 2020 | 10,777,698 | 2,783,637 | 7,994,061 |
| 2021 | 11,395,756 | 2,573,595 | 8,822,161 |
| 2022 | 19,459,427 | 7,349,695 | 12,109,732 |
| 2023 | 22,053,186 | 9,559,089 | 12,494,097 |
Source: Czech Statistical Office
| Foreign guests coming to Czech Republic, 2015 | 2017 | 2018 | 2019 | 2020 | 2021 | 2022 | 2023 | ||||||||
|---|---|---|---|---|---|---|---|---|---|---|---|---|---|---|---|
| Germany | 1,766,539 | Germany | 1,962,582 | Germany | 2,031,104 | Germany | 2,075,460 | Germany | 438,911 | Germany | 689,201 | Germany | 1,847,625 | Germany | 2,289,175 |
| Slovakia | 578,216 | Slovakia | 681,917 | Slovakia | 730,954 | Slovakia | 749,631 | Slovakia | 237,540 | Slovakia | 330,827 | Slovakia | 779.555 | Slovakia | 867,780 |
| USA | 508,951 | Poland | 575,643 | Poland | 620,495 | Poland | 671,857 | Poland | 171,260 | Poland | 234,925 | Poland | 614,798 | Poland | 759,074 |
| Poland | 484,573 | Russia | 548,318 | China | 617,935 | China | 609,727 | Netherlands | 63,426 | France | 98,765 | USA | 372,279 | USA | 490,188 |
| UK | 442,718 | USA | 540,572 | USA | 554,394 | USA | 584,627 | Austria | 61,012 | Italy | 93,527 | UK | 315,811 | UK | 453,381 |
| Russia | 434,852 | China | 489,845 | Russia | 544,216 | Russia | 564,083 | USA | 44,822 | USA | 89,471 | Ukraine | 286,168 | Italy | 390,973 |
Source: Czech Statistical Office


Log In